Math, Environmental Studies, Global Studies
Tips: Put Phrases in "Quotes". Use plus to require additional +terms. Use minus to omit additional –terms. Use | for an OR search
Your Search Results (33) sorted by newest

Bias in Charts: Temperature and Climate Change
Students analyze a chart from NASA and a tweet from the National Review for messages about climate change and bias in media construction of charts.
Please be patient. This download may take while depending on your internet connection
preparing files...
Middle School, High School
15-30 Minutes
Subject Areas

Social Media & Trigonometry: What's the Best Explanation?
Students analyze a YouTube video, an Instagram post and a TikTok video for messages about trigonometric functions and about the effectiveness of social media videos to learn and teach math.
Please be patient. This download may take while depending on your internet connection
preparing files...
High School
15-30 Minutes
Subject Areas
Math, Student Media Production, Film/Video Arts

Bias in Charts: Race, Gender, Education, and Income
Students analyze charts from the New York Times and a blog post for messages about income related to race and gender and about credibility and bias in media construction of charts.
Please be patient. This download may take while depending on your internet connection
preparing files...
High School
30-60 Minutes
Subject Areas
Math, Journalism, Economics, Sociology

Graphing the Vote: Age, Gender, and Time
Students will tell the stories behind political graphs by: analyzing graphs about generational voting, asking questions about the sourcing and target audience, and reflecting on patterns in youth voting. This lesson has the potential to promote polarization. See the advice in the lesson plan.
Please be patient. This download may take while depending on your internet connection
preparing files...
Middle School, High School
30-60 Minutes
Subject Areas
Math, US History, Civics And Government, Sociology

How Big is the Crowd? Proportional Reasoning and Critical Thinking
Students use mathematical reasoning to evaluate claims about crowd size for President Trump’s 2016 inauguration, and reflect on confirmation bias when assessing truth claims in the media.
Please be patient. This download may take while depending on your internet connection
preparing files...
High School, College
30-60 Minutes
Subject Areas
Math, Journalism, US History And Government, US History, Civics And Government, Sociology, General Media Literacy, Library/Information Literacy

Good Data - Bad Feelings: Graphing Economics, Public Opinion and Media Coverage
Students analyze graphs and media analysis for messages about the relationship between media reporting on the economy and public opinion.
Please be patient. This download may take while depending on your internet connection
preparing files...
High School, College
Over 60 Minutes
Subject Areas
Math, Psychology, Journalism, Civics And Government, Economics, Sociology, Library/Information Literacy

Flags: Geometry, Algebra and Cultural Context
This math and/or social studies lesson has students analyze flags from around the world, to understand aspect ratio, flag design and historical context.
Please be patient. This download may take while depending on your internet connection
preparing files...
Middle School, High School, College
30-60 Minutes
Subject Areas
Math, Civics And Government, Global Studies
.png)
Charting Media Coverage of War: Israel/Palestine
Students analyze charts with text excerpts from articles for messages about bias in media coverage of the Israel Hamas war, to analyze the bias in the construction of the charts, and to reflect on their own interpretations.
Please be patient. This download may take while depending on your internet connection
preparing files...
High School, College
30-60 Minutes
Subject Areas
Math, Journalism, Civics And Government, Global Studies, Sociology, Library/Information Literacy

Starter Kit for College
This guide gives users a brief overview of our approach (question-based media decoding) and materials (e.g., lessons) available for free from the Project Look Sharp website for a particular level and subject.
View
College
Subject Areas
DO IT YOURSELF GUIDE
Media Literacy And Critical Thinking Integration
Constructivist Media Decoding
Media Literacy Lesson Design
Document Selection
Question Design
Constructivist Media Decoding
Media Literacy Lesson Design
Document Selection
Question Design
Social Studies
English Language Arts
Health
Science And Environment
Math
Arts
Psychology
Media Production
Pre-service Teacher Education

Starter Kit for Math 6-12
This guide gives users a brief overview of our approach (question-based media decoding) and materials (e.g., lessons) available for free from the Project Look Sharp website for a particular level and subject.
View
Middle School, High School
Subject Areas
DO IT YOURSELF GUIDE
Media Literacy And Critical Thinking Integration
Constructivist Media Decoding
Media Literacy Lesson Design
Document Selection
Question Design
Constructivist Media Decoding
Media Literacy Lesson Design
Document Selection
Question Design
Math
Starter Kit for Elementary All Subjects 3-5
This guide gives users a brief overview of our approach (question-based media decoding) and materials (e.g., lessons) available for free from the Project Look Sharp website for a particular level and subject.
View
Upper Elementary
Subject Areas
DO IT YOURSELF GUIDE
Media Literacy And Critical Thinking Integration
Constructivist Media Decoding
Media Literacy Lesson Design
Document Selection
Question Design
Constructivist Media Decoding
Media Literacy Lesson Design
Document Selection
Question Design
Social Studies
English Language Arts
Health
Science And Environment
Math
Arts
Psychology
Media Production

Starter Kit for All Subjects K-2
This guide gives users a brief overview of our approach (question-based media decoding) and materials (e.g., lessons) available for free from the Project Look Sharp website for a particular level and subject.
View
Lower Elementary
Subject Areas
DO IT YOURSELF GUIDE
Media Literacy And Critical Thinking Integration
Constructivist Media Decoding
Document Selection
Question Design
Constructivist Media Decoding
Document Selection
Question Design
Social Studies
English Language Arts
Health
Science And Environment
Math
Arts
Psychology
Media Production

Math, Media, and Me
Students analyze web videos and feature film clips for messages about how mathematicians solve complex problems, our own reactions to math, and media portrayals of math problem solving.
Please be patient. This download may take while depending on your internet connection
preparing files...
Middle School, High School
15-30 Minutes
Subject Areas
Math, Psychology, Film/Video Arts, Library/Information Literacy, Pre-service Teacher Education
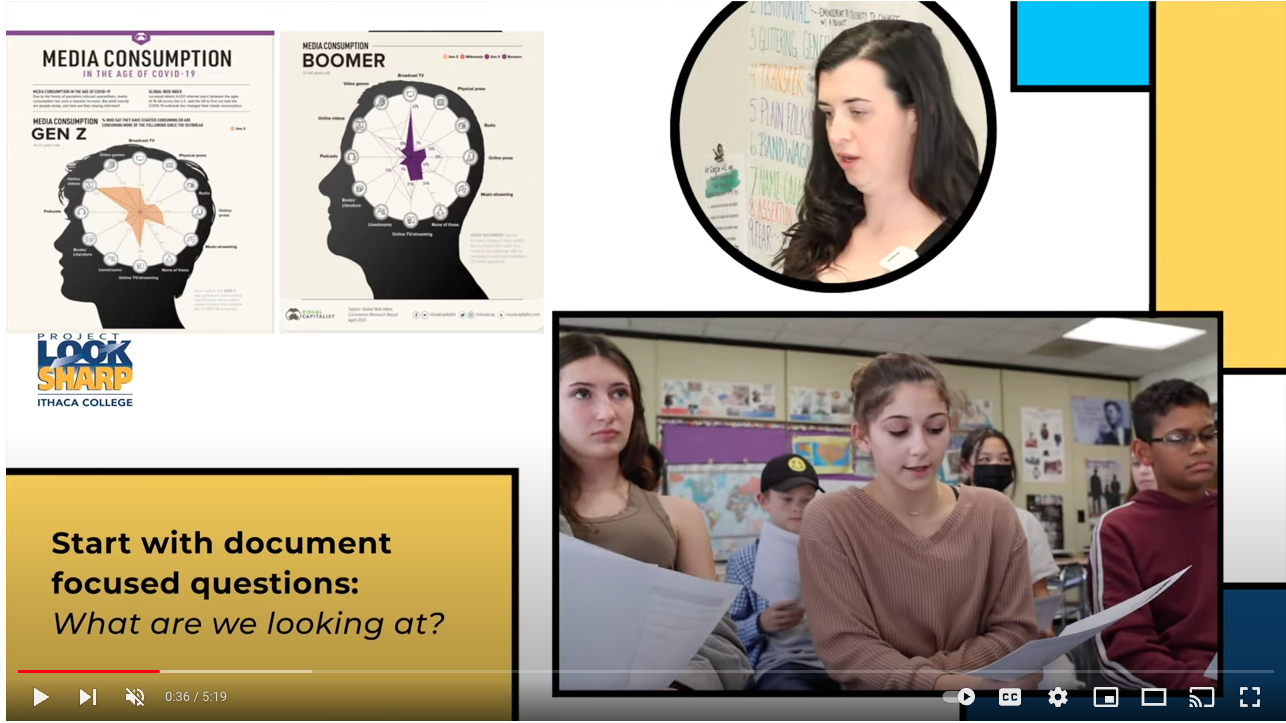
Demonstration Video: Interpreting Charts of Media Use: Gen Z vs. Boomers
Middle School teacher, Mary Kate Longeran, leads her students through a decoding of charts using the Project Look Sharp lesson “Changing Our Media Habits: The Impact of the Pandemic” – to teach students to analyze and question charts and explore differences in generational media use. (Total Time: 5:15) Published 2023
View
Middle School, High School
Subject Areas
DEMONSTRATION VIDEO
Media Literacy And Critical Thinking Integration
Constructivist Media Decoding
Youth Culture And New Technologies
Critical Thinking And The News
Assessing Credibility & Bias
Reflecting Diversity
Question Design
Constructivist Media Decoding
Youth Culture And New Technologies
Critical Thinking And The News
Assessing Credibility & Bias
Reflecting Diversity
Question Design
Social Studies
English Language Arts
Health
Math
Pre-service Teacher Education

Zero: Who Invented It and How Do We Know?
Students analyze short videos for messages about zero, when and where it was invented, the credibility and point of view of information, and about the influence of culture on history.
Please be patient. This download may take while depending on your internet connection
preparing files...
Middle School, High School, College
15-30 Minutes
Subject Areas
Math, Global Studies, Library/Information Literacy, ELA/English Language Arts

COVID-19 & Climate Change: Graphing the Connection
In this media literacy activity students analyze online graphs and text for messages about the connections between the COVID-19 pandemic and climate change.
Please be patient. This download may take while depending on your internet connection
preparing files...
High School, College
30-60 Minutes
Subject Areas
Health, Math, Journalism, Environmental Studies, Global Studies, Economics, Sociology

Changing Our Media Habits: The Impact of the Pandemic
In this media literacy activity students analyze charts, graphs and illustrations for messages about media consumption changes as a result of the COVID-19 pandemic.
Please be patient. This download may take while depending on your internet connection
preparing files...
Middle School, High School, College
30-60 Minutes
Subject Areas
Math, Psychology, Journalism, Consumer Education, US History And Government, US History, Civics And Government, Sociology, General Media Literacy, Library/Information Literacy

Comparing Renewables: U.S. vs. Global Energy Use
Media literacy and critical thinking activity in which students decode graphs for messages about how the use of renewable energy sources can help to reduce human vulnerability to climate change.
Please be patient. This download may take while depending on your internet connection
preparing files...
This lesson is part of a "kit" or collection of media decoding lessons on a particular topic. You can explore that kit using the link below:
Playlist: Global StudiesUnit: Energy Sources
Kit: Media Constructions of Sustainability: Middle School
Middle School
30-60 Minutes
Subject Areas
Math, Physical Sciences, Environmental Studies, Global Studies, Economics, ELA/English Language Arts

Drought & Farming: Thirsty Crops
Media literacy and critical thinking activity in which students decode web pages and graphs for messages about how agricultural demands for irrigation impact freshwater resources during times of drought.
Please be patient. This download may take while depending on your internet connection
preparing files...
This lesson is part of a "kit" or collection of media decoding lessons on a particular topic. You can explore that kit using the link below:
Playlist: Climate ChangeUnit: Climate Change & Water
Kit: Media Constructions of Sustainability: Middle School
Middle School
15-30 Minutes
Subject Areas
Math, Consumer Education, Physical Sciences, Environmental Studies, Economics, ELA/English Language Arts

Heroes for Animal Protection
Media literacy and critical thinking lesson analyzing a book and video about songbird steward Rachel Carson and composing a social message about being an animal steward.
Please be patient. This download may take while depending on your internet connection
preparing files...
This lesson is part of a "kit" or collection of media decoding lessons on a particular topic. You can explore that kit using the link below:
Unit: Animals (lower elementary)Kit: Media Constructions of Sustainability: Lower Elementary
Lower Elementary
Over 60 Minutes
Subject Areas
Health, Math, Student Media Production, Visual Arts, Film/Video Arts, Life Sciences, Environmental Studies, General Media Literacy, Library/Information Literacy, ELA/English Language Arts